Meliae is neat, but scary...
Written by
on
in
Snaking.
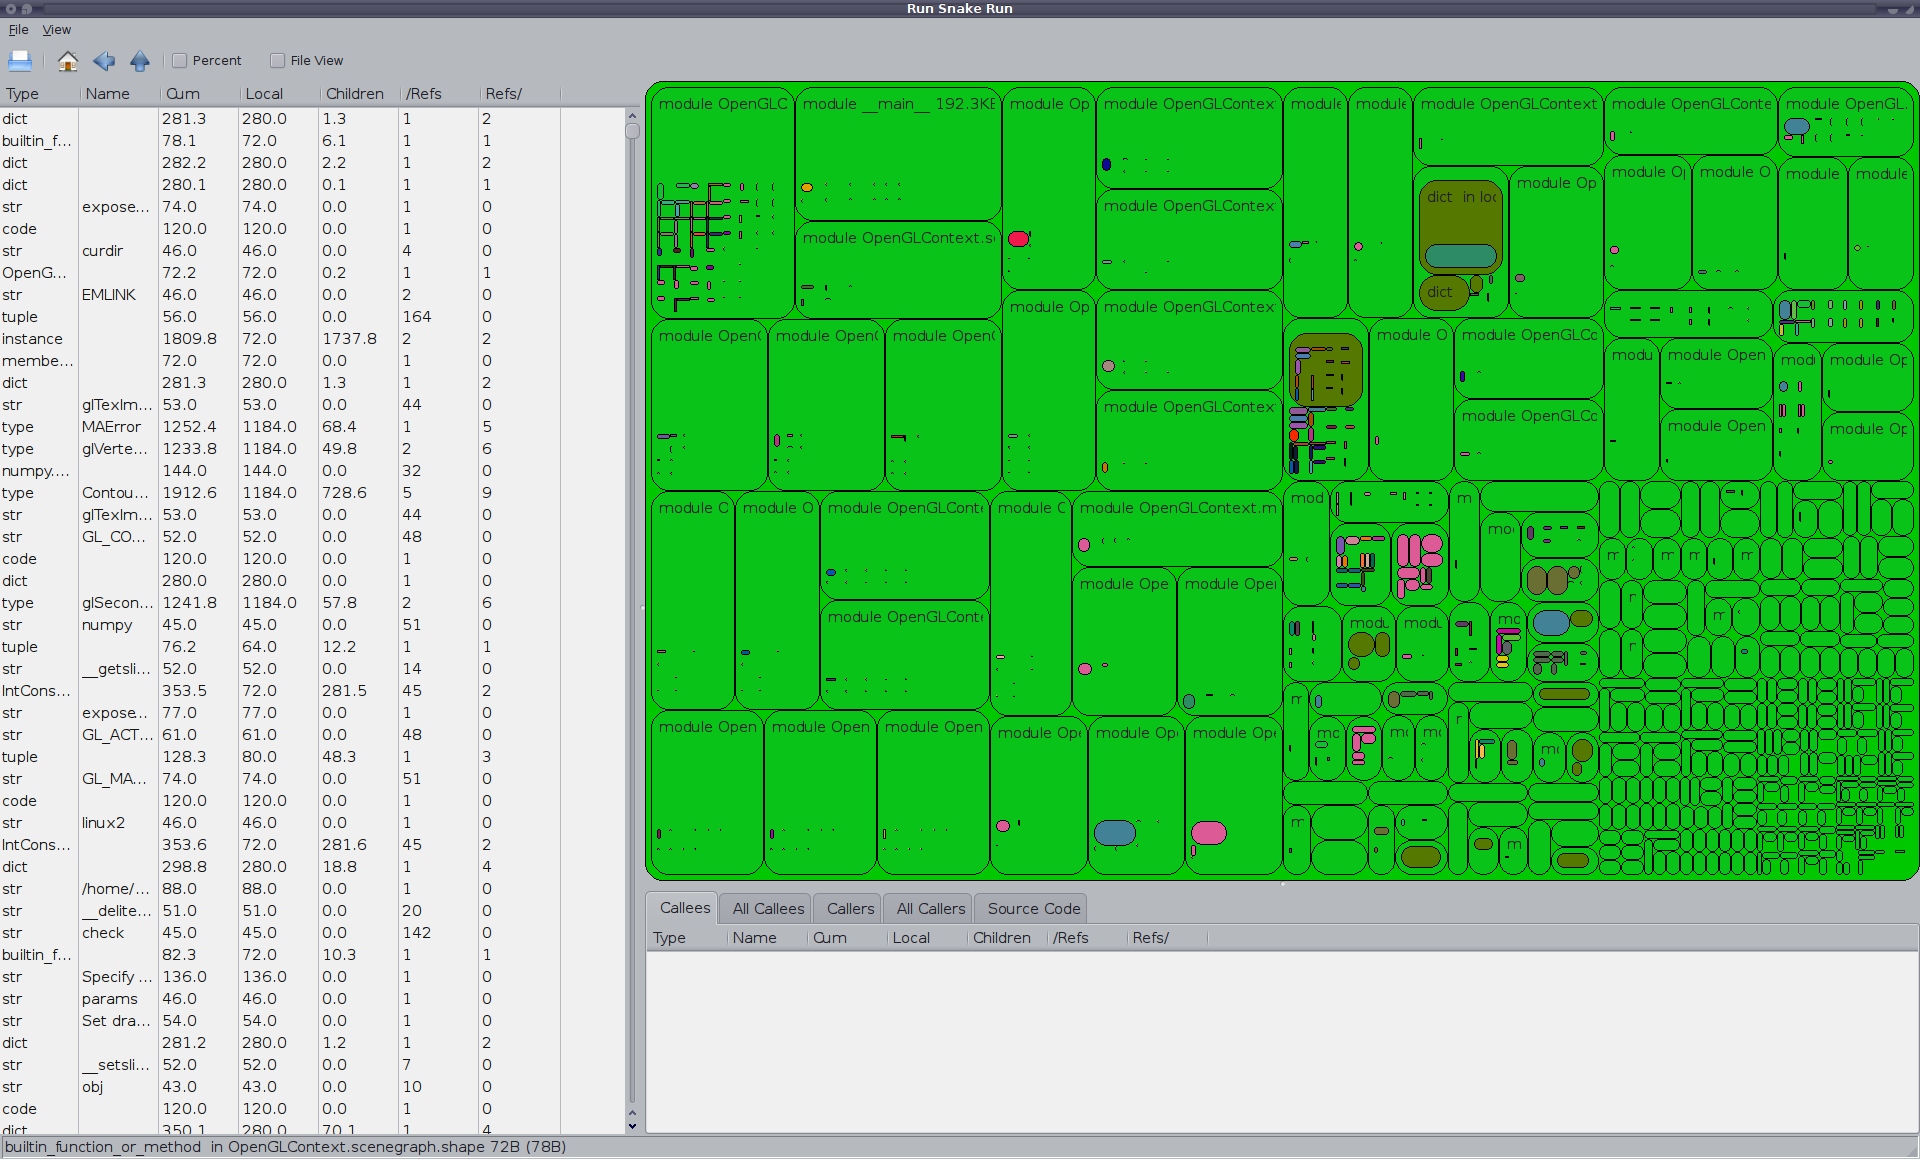
Anway, while the summary stuff it produces is okay, but I'm more of a visual type when I'm trying to find bugs, so I figured I would code up a Squaremap adapter for its output. A day's hacking later I seem to have a working adapter. The first thing I tried profiling was a trivial OpenGLContext application... oof.
Dictionaries, as mentioned in Dave's talk, get pretty expensive as they grow, and PyOpenGL and OpenGLContext are both pretty heavy on the "import *" uncool-fu. The graphs basically say "all of your ram belongs to the dictionary overhead of your module namespaces". Will have to reconfirm that I've wired everything properly, but it really does look like most of the bloat I was wanting to track down in OpenGLContext tests/demos is due to the basic API design. For the curious, to use meliae, do the following:
from meliae import scanner
scanner.dump_all_objects( 'dump.memory' )
Which writes out a very large series of json-encoded records. My little hack then reads those json records, performs various manipulations (including folding module, type and classobj dictionaries into their objects, finding out how many objects "share" an object, calculating recursive sizes, etc), and then displays them as a SquareMap.
[Update] Sample view
Comments
Comments are closed.
Pingbacks
Pingbacks are closed.

Mike C. Fletcher, the VRPlumber, is a philosopher of design turned computer programmer based in Toronto, Canada. He works primarily in the Python programming language, and maintains a large number of Open Source software packages. You can reach him at: mcfletch@vrplumber.com.
John on 03/15/2011 12:52 a.m. #
Be a little careful with squaremaps. The main problem is that memory consumption is often highly recursive. I tried to do something similar with RunSnakeRun, or other cpu profiler visualization. But while CPU time might be slightly recursive, memory references are heavily recursive.
Also, watch out for 'gc.get_objects()' which creates a list which refers to *everything*, etc. There are a few bits in the meliae loader code to try and handle it.
I haven't yet sorted out how to do a proper tracing from the top down. But if object A refers to object B, which also refers to A, where do you attribute the memory?
Mike Fletcher on 03/16/2011 9:40 p.m. #
Yeah, ironically memory issues will likely be an issue with the memory profiler :) . Mostly the problem is that e.g. a single integer will produce a dictionary with lots of metadata (much more ram than the original object). I find the memory pressure drops notably if I filter out the small objects, but then it's not as cool an "explorer" :) .
I've been using a pretty simplistic assignment heuristic, I take each module, take all objects which are referenced from the module, exclude all module references, then produce a recursive traversal assigning weighted sums to the parents of each object. That means some object in the cycle gets a 0-weight for the cycle, but it seems to produce a reasonable measure.
I'm planning to do something similar with type-only collections to provide the equivalent of the "all callers" in RunSnakeRun, that is, I think what's being done in meliae's summary views as well.